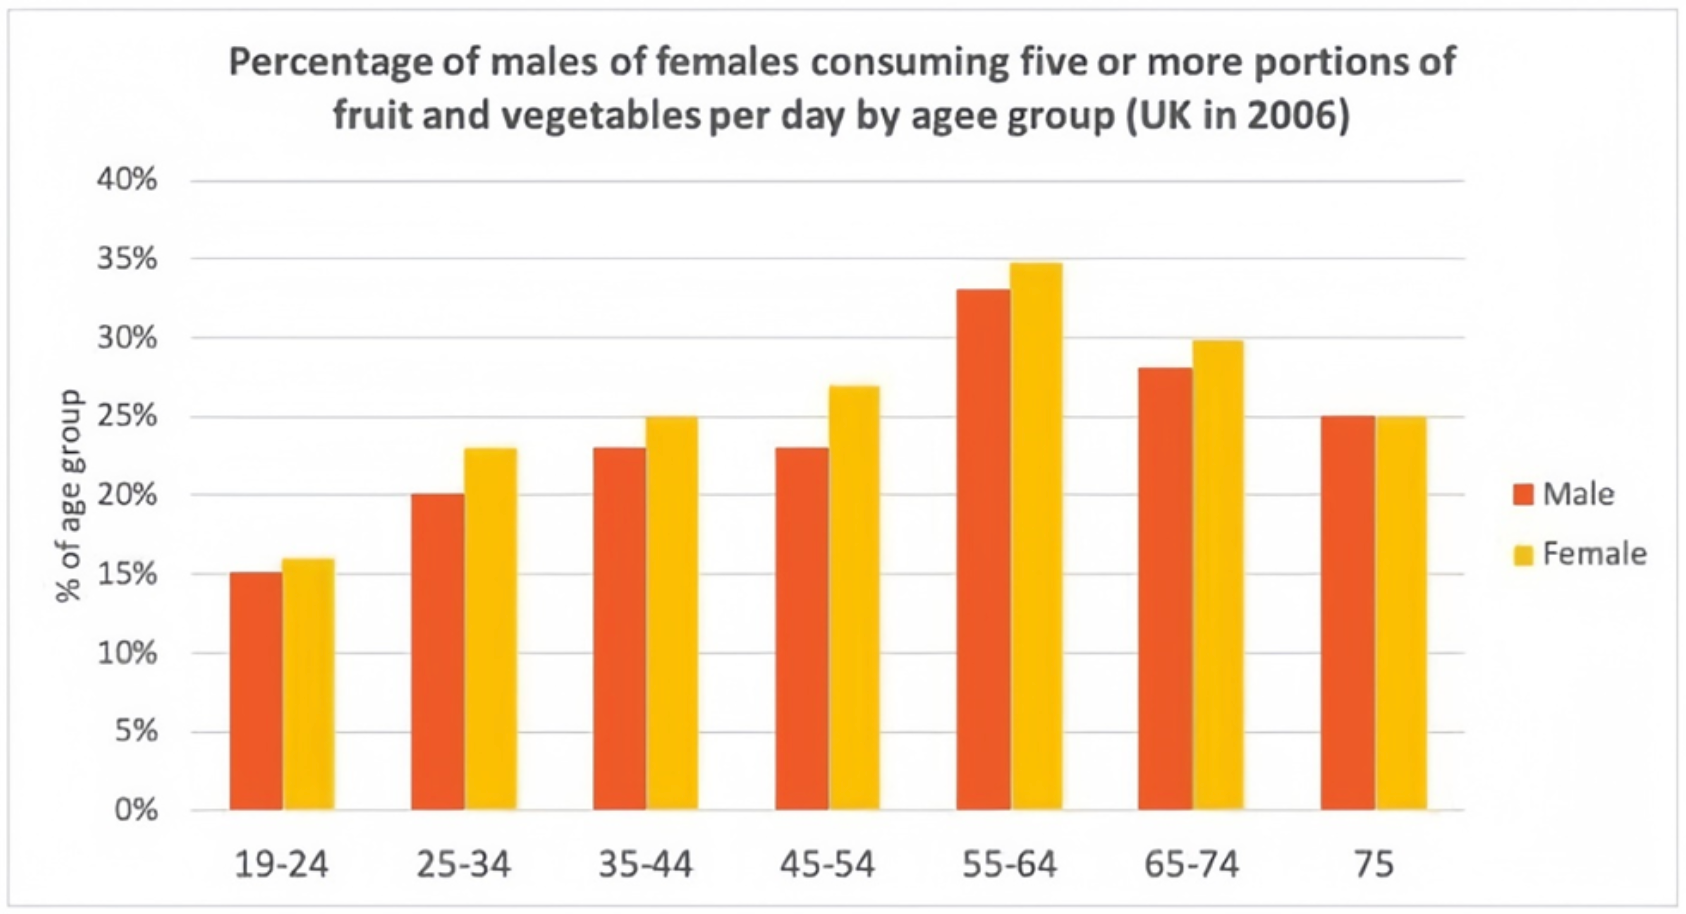

Exercise 1
You should spend about 20 minutes on this task.
Write at least 150 words.
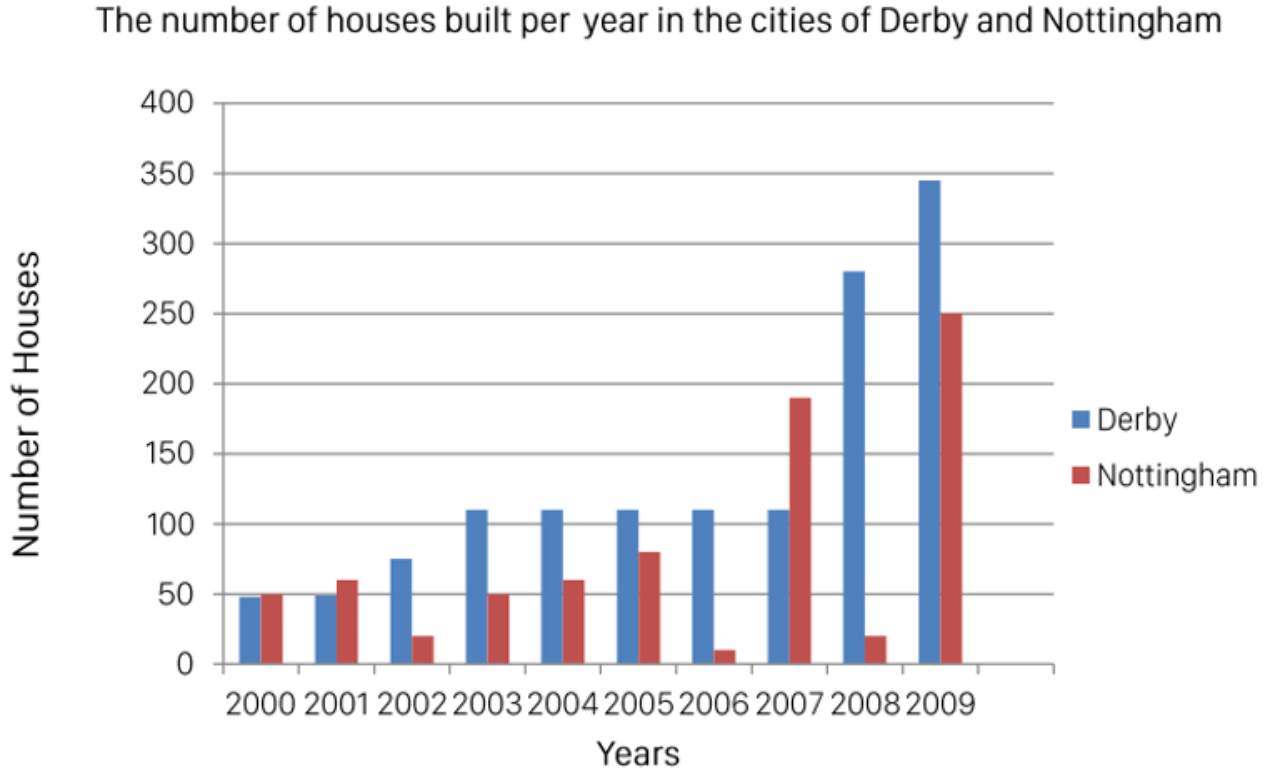
The bar chart below shows the number of houses built per year in two cities, Derby and Nottingham, between 2000 and 2009.
Summaries the information by selecting and reporting the main features, and make comparisons where revelant.